
Introduction to yield curve
The definition of a yield curve states that it is a line that plots interest rates of bonds that have an equal credit quality across differing maturity dates. The slope of the yield curve gives an idea of future interest rate changes and how the market participants estimate the current and future economic activity. When it comes to the real-world discussion about the yield curve, the news that talk about it usually point towards the government yield-related curve with the most important curve in the global economy being the U.S. Treasury debt yield curve that looks at the three-month, two-year, five-year, 10-year, and 30-year.
There are three types of yield curve that we can see in the real world:
- Normal, upwards-sloped yield curve. This curve has lower yields for shorter maturities and the yield is increases as we go up along the curve, hence the long-term investors are able lock in there investors for longer maturity at a large premium. Such curve implies stable economy and strong economic growth in the future.
- Inverted, downwards-sloped yield curve. For this curve we should expect the longer-maturities to yield lower returns to the investors. This type of the curve corresponds to an economic downturn, even a recession. The investors typically purchase longer-term bonds viewing them as safer and driving their prices higher, hence lowering the yields. This type of the curve is a common recession indicator.
- Flat yield curve. It has the similar yields across all maturities. There could be small deviations at some maturities, though they are insignificant. This curve displays high level of uncertainty in the market and is very typical after a strong market growth period.
The bond investors should remember that that bond prices and interest rates are inversely related. The price of bonds will decrease when market interest rates increase, and vice versa. These changes in the yield curve yields is called a yield curve risk.
Current Market
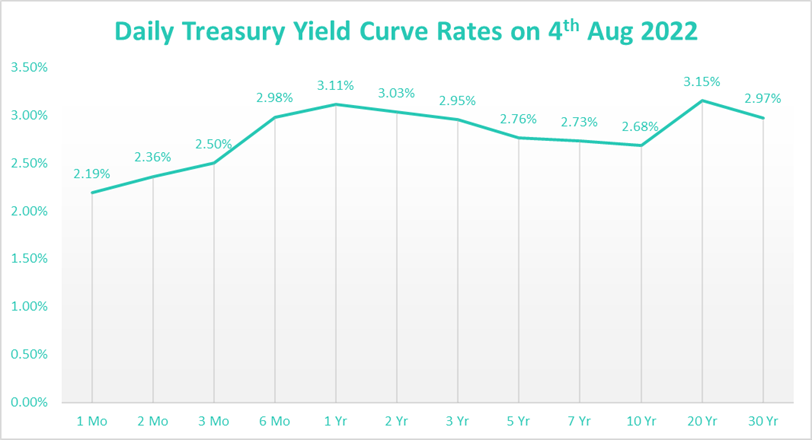
You can review the current Fed curve on the Treasury’s website and updated daily.
While the current yield curve looks close to flat (as of 4th August), the current yields a some of the maturities display a significant degree of inversion, which can be a strong indicator of a recession. US market had two consecutive quarters of a negative growth, which was the definition of recession before the current government has decided to change the definition rather than accept the fact that there is a significant economic downturn. We can see a sign of the recession from this graph if we look at 2- and 10-years maturities as they are among the most important ones. 10-year yield is at 2.68% and 2-year is at 3.03%, the inversion reaches 35 basis points, which is significant.
Please note, none of the information on this blog represents the opinion of my employer and all information does not represent a financial advice.

One thought on “What is a yield curve?”