
Intro
When it comes to investing, majority of people directly think about returns and how much one can make by allocating their funds. However, the returns come hand in hand with another measure of investment performance – risk. While the returns are easily observable, measuring risk can be more tricky and have multiple layers of how we can approach them.
In this article we will look into the base scenario of how we can look into risk of public equities using the same portfolio we have explored in earlier article about performance.
For easier reference, we had the following instruments in our imaginary portfolio:
- Apple
- Tesla
- Amazon
- Netflix
- Ford Motor Company
- Lockheed Martin Corporation
- The Walt Disney Company
- The Coca-Cola Company
- Verizon Communications
- Bayerische Motoren Werke AG (BMW)
Concept of Standard Deviation
The standard deviation (denoted as σ) is a measure of variation or dispersion. In our case this would measure the stock returns, and lower standard deviation indicates that the values tend to be close to the mean (or our expected returns). The higher standard deviation values would imply the higher variability of the equity instrument’s expected returns.

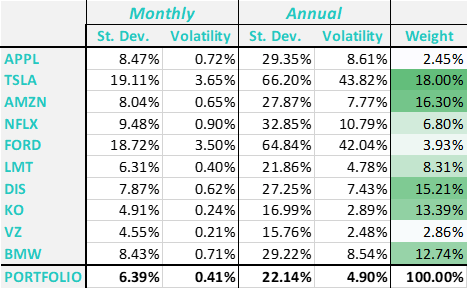
Looking back at our selection of the stocks, we can see that TSLA, and FORD had the highest Standard Deviations over the past five years, while KO and VZ had the lowest deviations in their returns. As our data is based on monthly returns, it refers to the monthly measure of risk.
Concept of Correlation
Correlation (denoted as ρ) is a statistical relationship between two variables. It does not imply causation, rather statistical association, and linear relation between them. In the financial markets the correlation is important for understanding portfolio risks as the correlation between the assets might imply either higher or lower risk being present in the portfolio of the assets.
For this exercise we will need to calculate the correlation table for all our instruments in excel. There are multiple ways to do that, however the easiest one is by using the built-in excel ‘Data Analysis’ tool that is located under the data tab. If it is absent for you, then you need to go ‘Options -> Add-ins -> Manage Excel Add-ins’ and add a tick next to ‘Analysis ToolPak’.
After the tool appears in ‘Data’ tab, you need to go ‘Data Analysis’ and select correlation. After some formatting changes, the tables looks as follows:
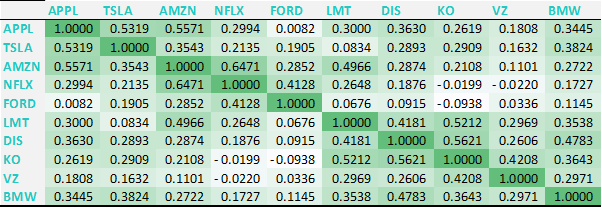
Some of the findings we can indicate here based on our observed period:
- FORD & APPL had almost no correlation between each other (0.0082)
- NFLX & AMZN had the highest correlation among the instrument pairs (0.6471)
- Some of the pairs had negative correlation: NFLX & KO (-0.0199), NFLX & VZ (-0.0220), and FORD & KO (-0.0938)
Concept of Covariance
I have suggested looking into the correlation first as it gives a better representation of our data to look at, however it requires the additional steps to get our portfolio variance calculated. Covariance does not provide us much information alone only an intermediary step in calculation.
The following formula would need to be applied to get to the covariance matrix:

Alternatively, we can utilise the in-built excel functionality again by picking covariance instead of correlation from the last menu. Regardless the approach we take, we would get the following results:

Portfolio Risk Calculation
Volatility is the measurement of how frequently the stock price deviates in a specific period. Higher volatility represents more risky investment. However, the most used measure is Standard Deviation, which is just a square root of that measurement. We have discussed it earlier and its advantage is that we can use this measure to compare the various portfolios.
The following calculation formula is used for variance estimation:

The formula looks scary; however, I can ensure you, excel can do all the heavy lifting for you. The attached spreadsheet offers provides a detailed step by step approach based on steps described in this article. As we had a data calculated on the monthly basis, we have provided the measurements for both Monthly and Annual periods.
Excel Document
Additional Thoughts
Our example is only covering the public equities in absence of transaction costs, taxes, and ongoing fees. All of those would cause additional impact on our observations.
Additionally, other instrument types would have different risk profiles all together. For example, private (direct) investments that are priced infrequently would have their returns smoothened and hence the risk would appear much lower than it is.
Moreover, when we get into the derivatives world – the measurement could become even more complicated. For instance, options have a completely different risk profile, and their risk is usually measured in terms of a range of ‘Greeks’. They denote the following risk exposures of the options to the underlying or the overall market.
There are a lot of considerations that we can touch upon in future. As of now, these tools are sufficient to analyse the portfolios that consist of publicly traded equities.
Please note, none of the information on this blog represents the opinion of my employer and all information does not represent a financial advice.

One thought on “Measuring Risk 101”